
Power BI Dashboard Filters sometimes cause confusion.
In one of my many communication channels, there was a question posed related to the ability to add Power BI dashboard filters in order to filter Power BI dashboard tiles. There is some confusion at times and I would like to make a short article to clear some of them up if possible.
1 – Tiles pinned to a dashboard are displayed based on the filters applied to them via the filter pane OR via slicers OR via cross filtering at the time of pinning.
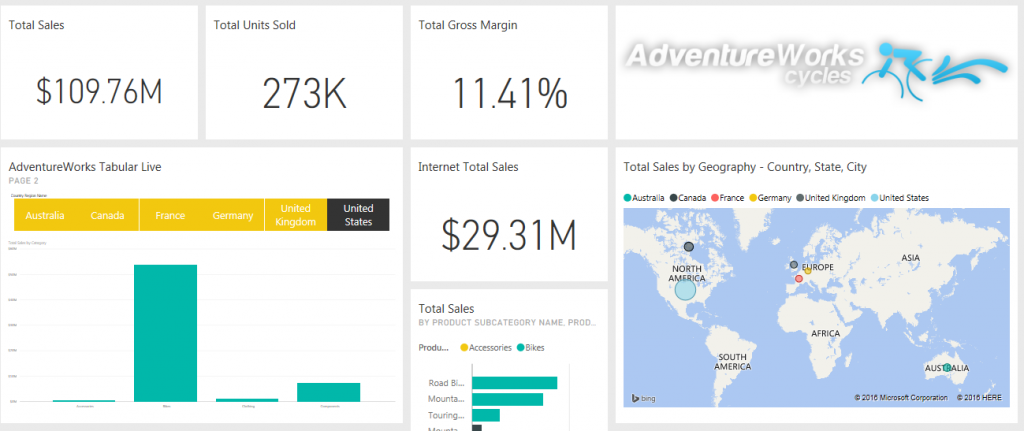
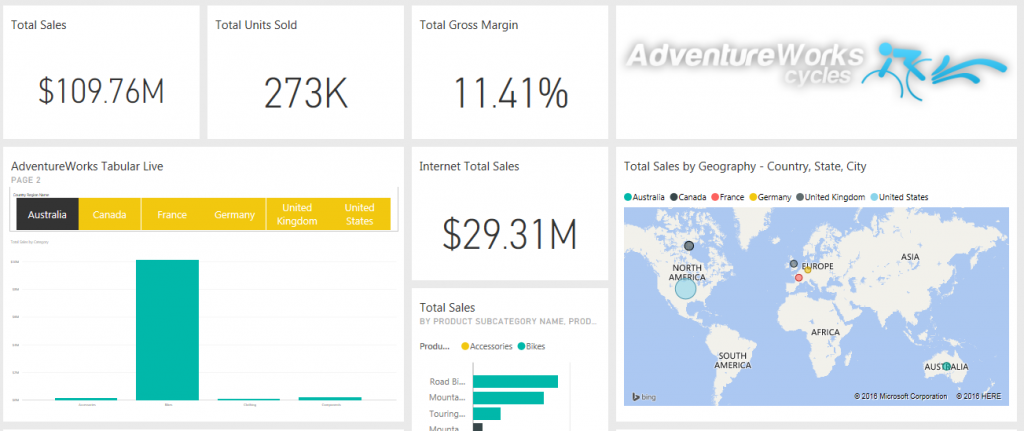
For example, I have a report that is currently unfiltered.
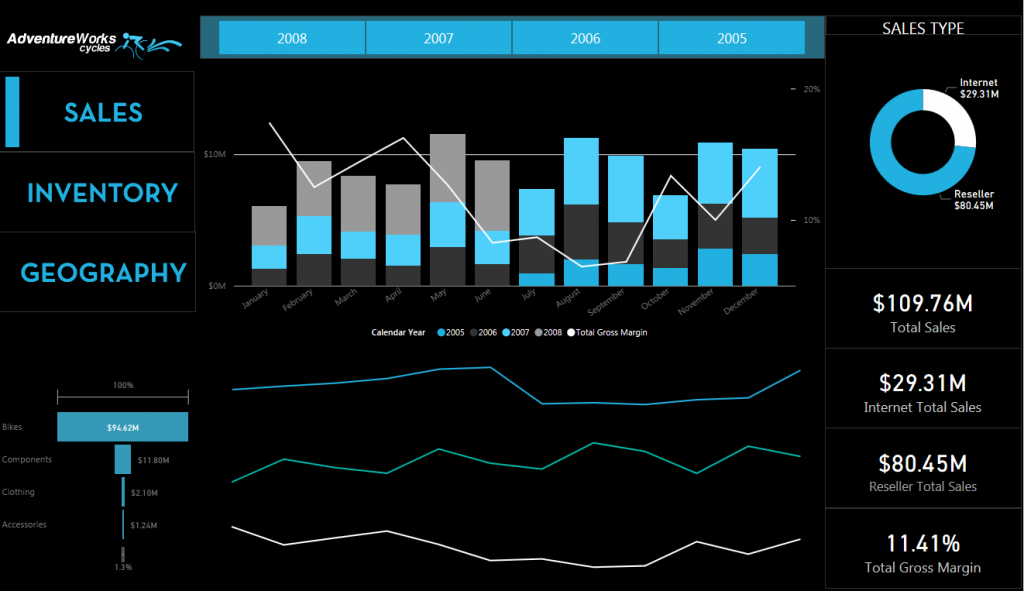
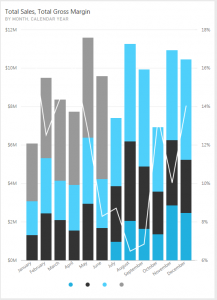
I pin the top combo chart to my dashboard unfiltered.
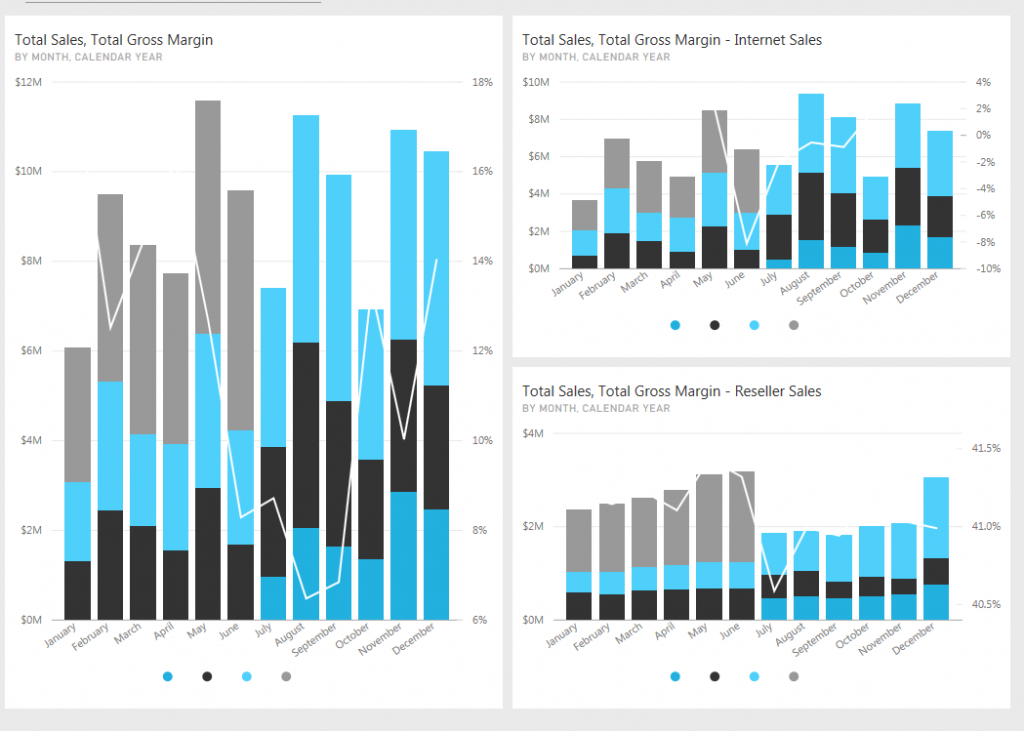
I cross-filter for reseller sales, pin the resulting visual to my dashboard, cross-filter for internet sales, and pin the resulting visual to my dashboard.
The dashboard will show the tiles as they were at the time of pinning….i.e. one visual unfiltered, one filtered for reseller sales, and one for internet sales.
2 – Use dynamic calendar filters for dynamic dashboards
Create calculated columns on your calendar table that flag your required date periods – i.e. ‘Current Day’, ‘Current Month’, ‘Current Quarter’, ‘Current Year’, etc. or a Period selection table and measures that utilize the period selection (i.e. http://www.bipatterns.com/select-time-period-with-slicers-and-dax/). Filter the dashboard utilizing the calculated columns or the Period selector and pin those visuals to your dashboard.
3 – Dashboards do not currently have filters that will allow filtering across tiles
This makes sense as you are able to have tiles from different reports that do not share filters.
4 – If you would like the ability to filter specific tiles on a dashboard, pin live report pages
However, design the report page specifically for a dashboard tile.
For example, create one visual w/ on main slicer:
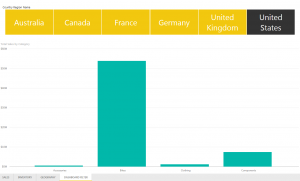
Pin this visual to your dashboard and you will have the ability to change the filter on that specific dashboard tile.
and I can now filter the tile from the dashboard w/o going to the report:
I hope this helps clear up some confusion or assists you in a project.
Thank you very much! Direct to the point
Question: AFTER you have pinned a visualization to a dashboard, how can you tell what slicers/filters/cross-filtering are in effect?
Obviously, this is quite important for QA, and in the case where someone else pinned the visualization and you want to see what filters are in place.
Yes – this is definitely an issue – if the tile is filtered differently than the default filtering and without a good description by the tile author, you are not able to see the filters applied at the time of creation.
There is a Power BI idea to vote for this functionality – I am surprised it has so few votes: https://ideas.powerbi.com/forums/265200-power-bi-ideas/suggestions/16693726-dashboard-tiles-ability-to-show-filter-context
This might be a silly question but, will the tiles update as the reports do?
If I pinned it in sep will it display info for October when in October, taking that everything is set for the report to be automatically updated?
no such thing as silly questions
the tiles are pinned based on the filters set @ the time of the pinning. so, if you explicitly filtered for a month (i.e. sept), in october, the pinned tile would still show sept data
so, when building tiles, follow tip #2 (2 – Use dynamic calendar filters for dynamic dashboards) – i.e. create a filter for “current month” – and as the data gets updated to a new month, your pinned tile will also change to the current month